Dashboard
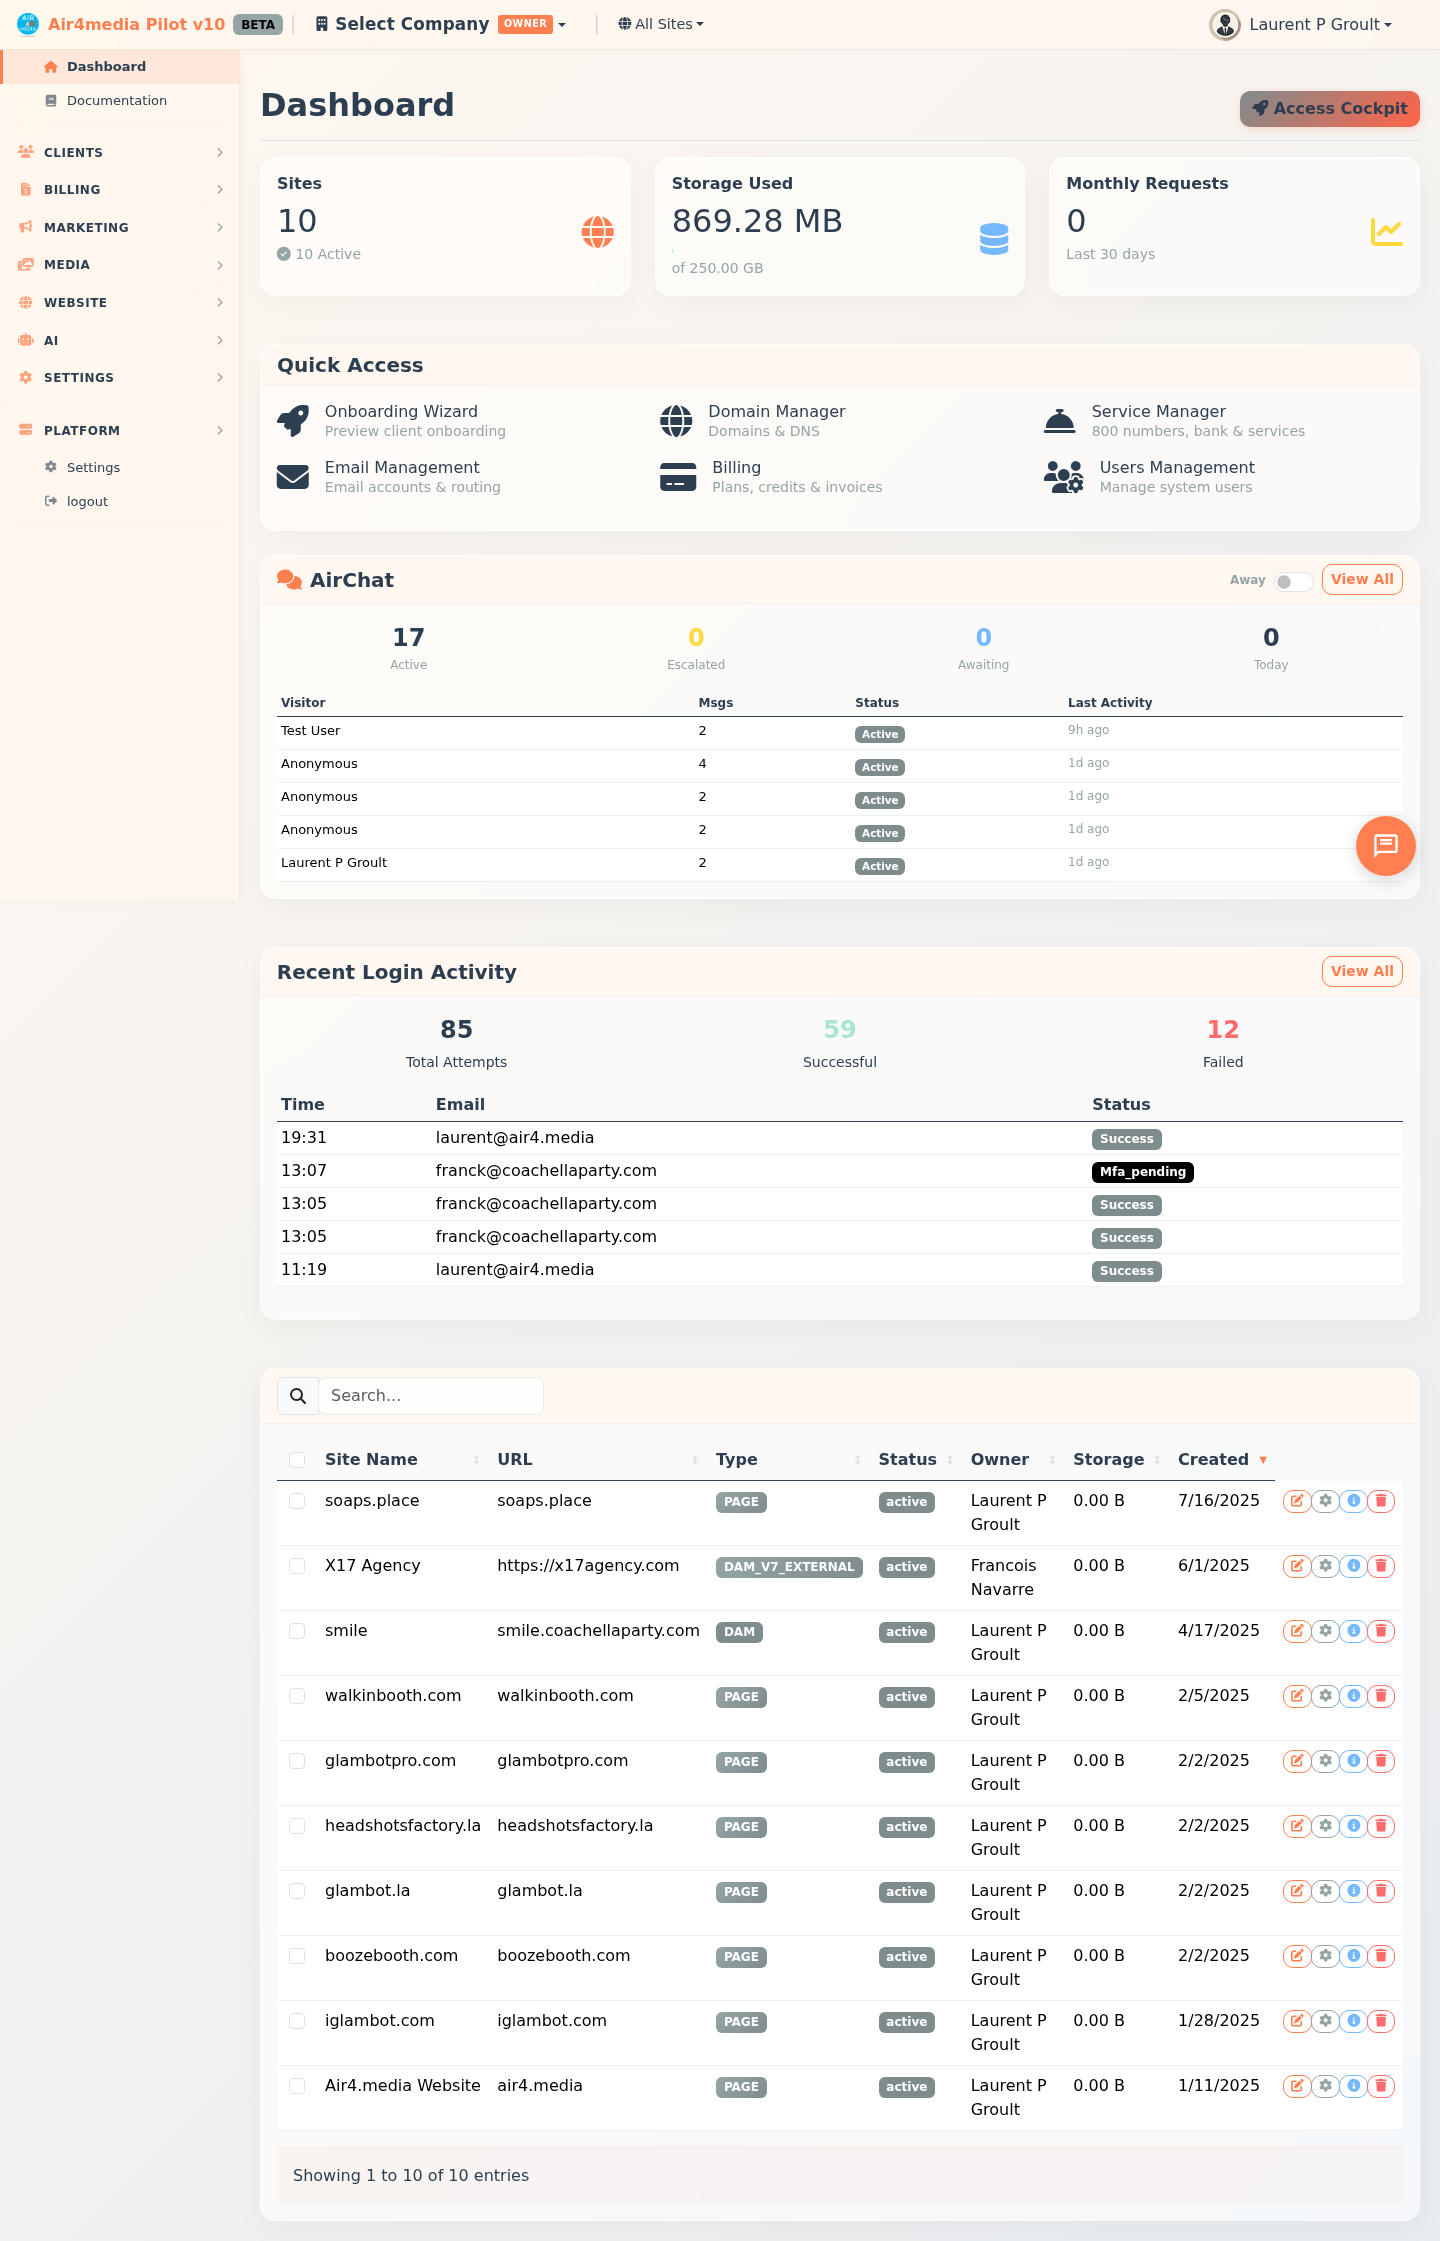
The Dashboard is your home page in Pilot — a live command center giving you an instant overview of your account, sites, activity, and plan usage the moment you log in.
Key Features
- AI Greeting Banner: A time-aware greeting ("Good morning, Laurent") with today's date and smart insight chips showing what needs attention — overdue invoices, pending payments, 30-day revenue, escalated chats, failed emails, new contacts, and more. Each chip is clickable and takes you straight to the relevant page.
- Live Metrics Strip: Five compact cards showing real-time counts for Sites, Storage, Active Chats, Emails Today, and Contacts — each with a secondary badge for added context (e.g. active site count, queued emails, contacts added this week).
- Quick Actions: Shortcut cards for your most-used tools. Regular users see Site Builder, CRM, AirMail, Invoices, Assets, AirChat, AirForms, and Settings. Admin users see system tools: Domains, Billing, Users, Services, Knowledge Base, and more.
- Pre-Flight Setup Card: New accounts see a 3-step setup card for domain, email, and payments. Each step shows its current status with a Continue Pre-Flight button. The card disappears once all three steps are complete.
- Usage Meters: Color-coded progress bars for each plan allowance — emails, AI credits, storage, contacts, and SMS. Your current plan appears as a badge (e.g. "Business Class — $29/mo"). Green is healthy, yellow means plan ahead, red means act now.
- Usage Warning Banner: Appears automatically when any metric reaches 80% or more of its limit (turns red at 95%). Lists all affected metrics and links directly to Billing.
- AirChat Activity Widget: Shows a live summary of your chat conversations — active, awaiting, and escalated — when AirChat is enabled on your account.
- Feedback Leaderboard: Displays ranked feedback scores across your sites when feedback data is available.
- Sites List: All your websites with URL, type, status, and storage usage. Supports sorting and search. Create new sites or manage existing ones directly from this panel.
- Recent Activity: A timeline of your last 15 account events — emails sent, campaigns launched, file uploads, payments received, form submissions, and more — with time-ago timestamps.
- Welcome Banner: Shown to new accounts with your company name, a module-based setup checklist, and a Take a tour link. Can be dismissed once you're set up.
- Guided Tour: A 6-step spotlight walkthrough covering the Dashboard, Flight Instruments, Site Builder, CRM, AirMail, and Assets. Progress is saved so you can resume where you left off.
How to Use
- Open Pilot — the Dashboard loads automatically as your home page.
- Check the AI Greeting insight chips for anything requiring immediate attention.
- Glance at the Live Metrics Strip for a real-time snapshot of your account.
- Use Quick Actions to jump directly to your most-used tools.
- If the Pre-Flight Setup card is visible, click Continue Pre-Flight to finish configuring your account.
- Monitor the Usage Meters — if a warning banner appears, click Manage in Billing to review or upgrade your plan.
- Scroll down to Sites to open, manage, or create websites.
- Check Recent Activity for a log of the latest actions on your account.
Tips
- Insight chips in the greeting banner are clickable — they take you straight to the page where you can act on the issue.
- Usage bars change color as usage climbs — green is fine, yellow means plan ahead, red means act now.
- The welcome banner can be dismissed and won't reappear once closed.
- Click Take a tour in the welcome banner for a guided spotlight walkthrough of the platform.
- Admin users see additional system management shortcuts and service health alerts in the Quick Actions grid.